
 Brampton Road, St Albans, Hertfordshire AL1 4PR |


Level 2 Examination Results
We’re very proud of the progress made by our Key Stage 4 students (those who are 16 and take exams in the summer of year 11.)
In 2026, students at Verulam progressed, on average, over half a grade more in each subject than their peers nationally and we estimate around three quarters of a grade higher if we just look at boys. This places Verulam in the top 20% of schools nationally for the last four years!
| GCSE Results | 2026 | 2025 | 2024 | 2023 |
|---|---|---|---|---|
| Progress 8 | 0.57 (est) | 0.5 (est) | 0.4 | 0.36 |
| Attainment 8 | 5.45 | 5.3 | 5.2 | 5.5 |
| 4 or higher in English & Maths | 77% | 73% | 77% | 79.1% |
| 5 or higher in English & Maths | 64% | 54% | 57% | 64.8% |
| 4 or above in English | 85% | 83% | 85% | 86.3% |
| 5 or above in English | 75% | 70% | 73% | 78% |
| 4 or above in Maths | 81% | 75% | 81% | 81.3% |
| 5 or above in Maths | 70% | 58% | 62% | 68.1% |
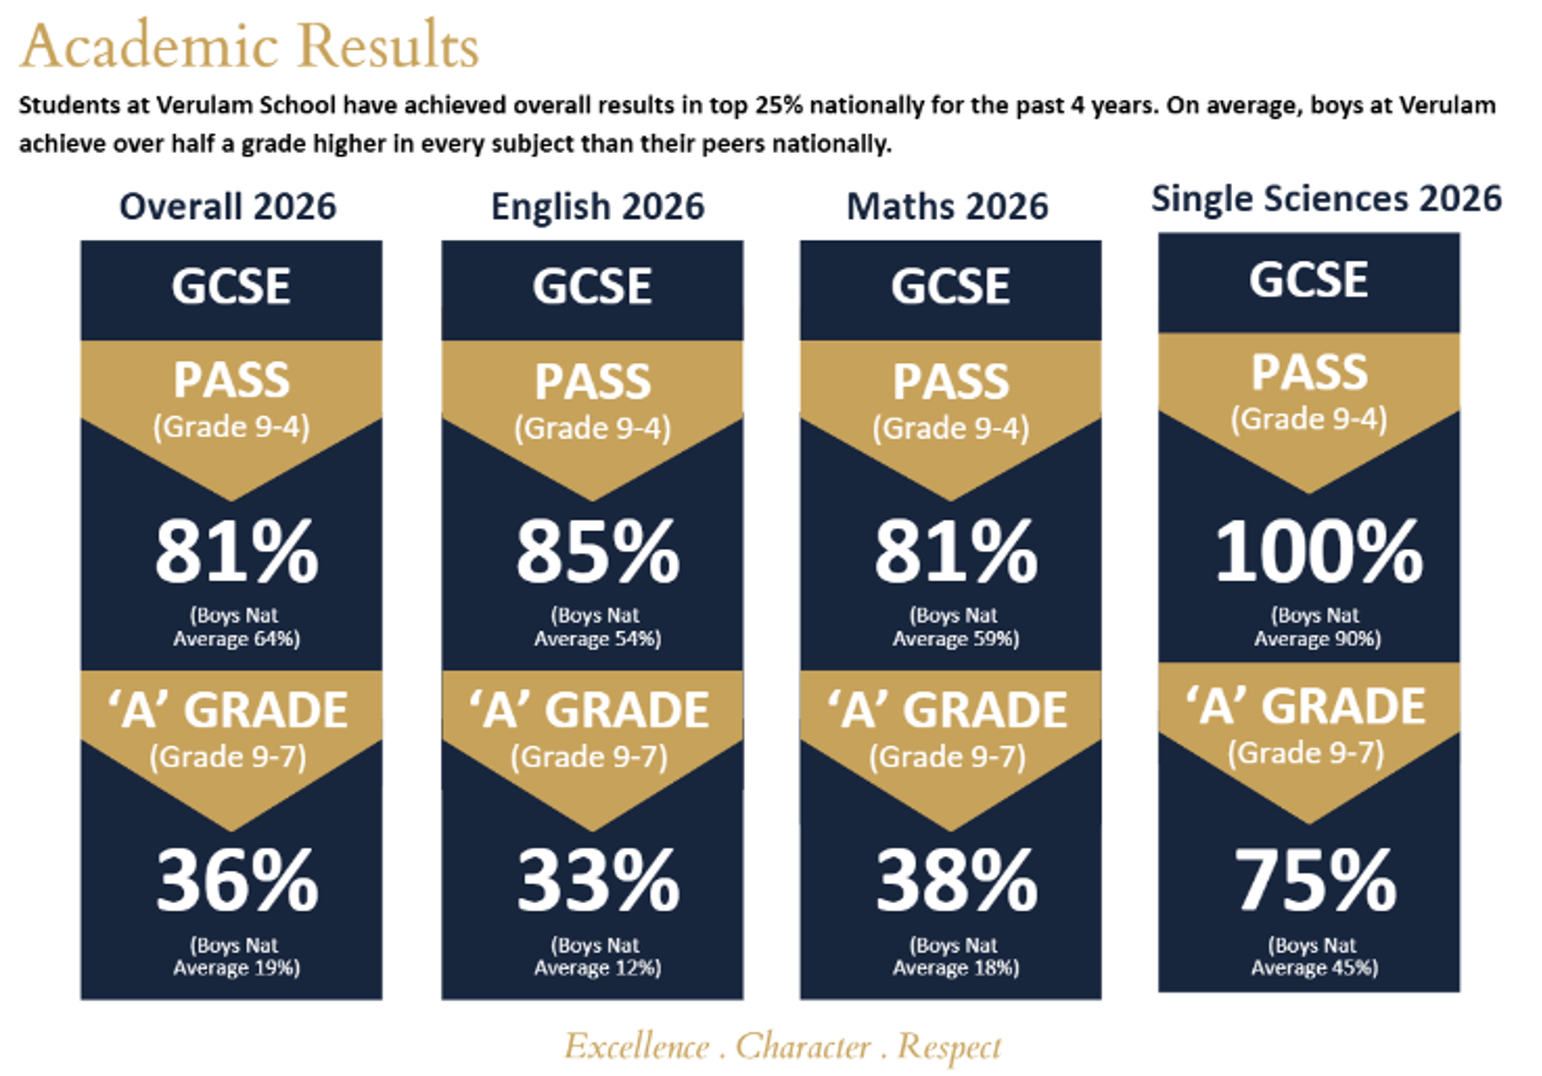
Comparisons at Key Stage 4 with other co-educational schools can be misleading as girls typically gain higher academic outcomes than boys at GCSE. The graphic below illustrates how Verulam performs versus boys on a national basis, showing the large positive value added that Verulam supports boys to achieve.
To view Verulam School’s Performance Table data, click here.
For a breakdown of Verulam pupil destinations following KS4 please click here for the latest data from the government.
Level 3 Examination Results
We’re also very proud of the achievements of our Key Stage 5 students (those who are 18 and take exams in the summer of year 13.) We wish our leavers every success in their ongoing education and future careers. The vast majority of our KS5 students (~80%) are now studying at universities across the country. Others have taken degree apprenticeships at prestigious companies or entered further education or employment.
In 2026, we estimate Level 3 Value Added, a score that indicates that a school has helped make greater progress than the national average, at +0.34. This means that Verulam students achieved over a third of a grade higher in each of their 3 or 4 subjects than their peers nationally (students with the same GCSE scores)
| A Level Results | Average Points Score Per Entry | Average Grade Per Entry |
|---|---|---|
| 2026 | 32.4 | C+ |
| 2025 | 32 | C= |
| 2024 | 31 | C= |
| 2023 | 34 | C+ |
| Vocational Results | Average Points Score Per Entry | Average Grade Per Entry |
|---|---|---|
| 2026 | 27 | Merit+ |
| 2025 | 28 | Merit+ |
| 2024 | 27 | Merit+ |
| 2023 | 30 | Merit+ |
APS – Average Point Scores.
To view Verulam’s 16-18 Performance Data, click here.